In 2013, oral health-related providers received an average of $60 per Medicare service performed, according to research from the U.S. Centers for Medicare and Medicaid Services (CMS) released on June 1. In contrast, the average payment for all types of healthcare professionals was $304 per Medicare service.
The research includes two reports that detail hospital in- and outpatient information, as well as data about services and procedures provided to Medicare beneficiaries by physicians and other healthcare professionals. CMS released the data reports on 2013 Medicare information as part of the Obama administration's efforts to promote smarter spending.
"These data releases will give patients, researchers, and providers continued access to information to transform the healthcare delivery system," stated acting CMS Administrator Andy Slavitt in a press release. "It's important for consumers, their providers, researchers, and other stakeholders to understand the delivery of care and spending under the Medicare program."
CMS found that 950,000 distinct healthcare providers collectively received $90 billion in Medicare payments in 2013.
Oral health providers are paid less
On average, all providers received $303.77 per Medicare service in 2013. However, when isolated from other types of physicians, oral health-related providers, which includes dentists and some types of anesthesiologists and surgeons, only collected an average of $59.87 in Medicare payments per service.
Of all the oral health-related Healthcare Common Procedure Coding System (HCPCS) code descriptions, the following services received the largest Medicare payment amount.
| HCPCS oral healthcare-related codes with highest average medicare payment | |||
| Service | Average payment | ||
| Impression of custom preparation of prosthesis for roof of mouth enlargement | $531.66 | ||
| Impression & custom preparation of lower jaw bone prosthesis | $531.51 | ||
| Impression & custom preparation of roof of mouth prosthesis | $455.07 | ||
Descriptions of the medical procedures are from the Current Procedural Terminology (CPT) code set.
Notably, many types of oral healthcare-related services received an average Medicare payment of $0, and "removal of tongue, floor of mouth, jaw bone, tissue, and lymph nodes" had an average payment of just $0.01.
Additionally, oral health-related providers performed about 4 million Medicare services in 2013. Biopsies of a "single growth of skin, tissue, or mouth" were by far the most common oral health-related HCPCS code used, both in terms of providers and number of services.
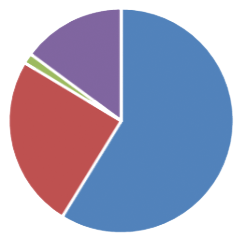
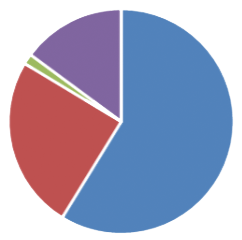
"Open surgical treatment of a fracture at the roof of the mouth or cheek bone" accounted for the least number of oral health-related Medicare providers and services, with just 11 providers and 11 services performed in 2013. "Treatment of broken nasal and check bones with wiring or splinting of teeth" and "anesthesia for procedure on facial bones or skull" also had 11 services performed.
More data to come
The administration has set a goal to move Medicare toward paying providers based on the quality, not quantity, of care they give patients. According to CMS, the two data releases are part of the initiatives to achieve that standard of better care.
"Data transparency facilitates a vibrant health data ecosystem, promotes innovation, and leads to better informed and more engaged healthcare consumers," stated Niall Brennan, CMS chief data officer and director of the Office of Enterprise and Data Analytics. "CMS will continue to release the hospital and physician data on an annual basis so we can enable smarter decision making about care that is delivered in the healthcare system."


