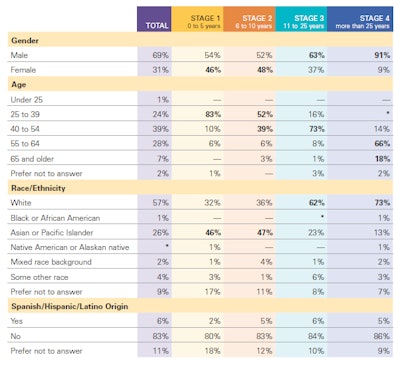

*Less than 1%.
Note: Bold numbering indicates significant difference at 95% confidence level.
Source: Dental Health Information Technology Survey. Edge Research. April 2010.
Note: Bold numbering indicates significant difference at 95% confidence level.


