Nearly 40% of the U.S. population is now classified as obese, but the rate of obesity varies widely across different U.S. states and the District of Columbia. Personal finance website WalletHub compiled nutrition and obesity data in the U.S. to better map the differences among the states.
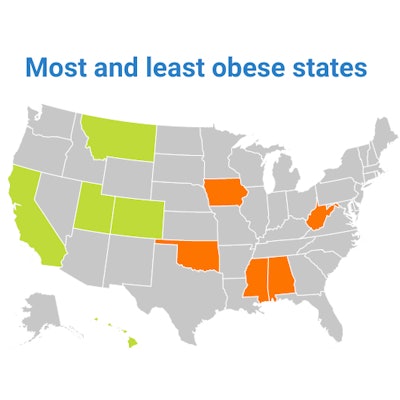
In WalletHub's analysis, Mississippi ranked as the "fattest" state in the U.S. According to the U.S. Centers Disease and Prevention (CDC), 39.5% of adults in Mississipi were classified as obese, more than 10% higher than the obesity rate in Utah, the "fittest" state in WalletHub's rankings.
Obesity has been previously linked to inflamed gums in children and periodontal disease in adults, as well as several systemic diseases, including heart disease, stroke, and type 2 diabetes. WalletHub reported that the U.S. spends nearly $200 billion annually on obesity-related healthcare costs, a statistic that prompted the website to further investigate rates of fatness and obesity.
To come up with the rankings, WalletHub experts used 29 relevant metrics, including the percentage of overweight and obese adults and children, the percentage of adults with type 2 diabetes, sugary drink consumption, and levels of physical activity.
See more findings from WalletHub's analysis in the infographic below.