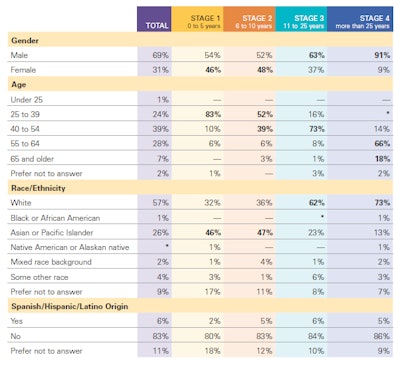
Demographics, by stage of practice, California, 2010Aug 30, 2010FacebookLinkedInX (Twitter)Pinterest Add us as a preferred source on Google *Less than 1%. Note: Bold numbering indicates significant difference at 95% confidence level. Source: Dental Health Information Technology Survey. Edge Research. April 2010. close FacebookLinkedInX (Twitter)Pinterest Add us as a preferred source on Google Latest in HomeDental assistant sentenced to 40 years in prisonJuly 23, 2026The way you live may be causing mouth ulcersJuly 23, 2026Opinion: Dental AI must solve practice problems, not create new onesJuly 23, 2026Root canal patients get antibiotics, often for no reasonJuly 23, 2026